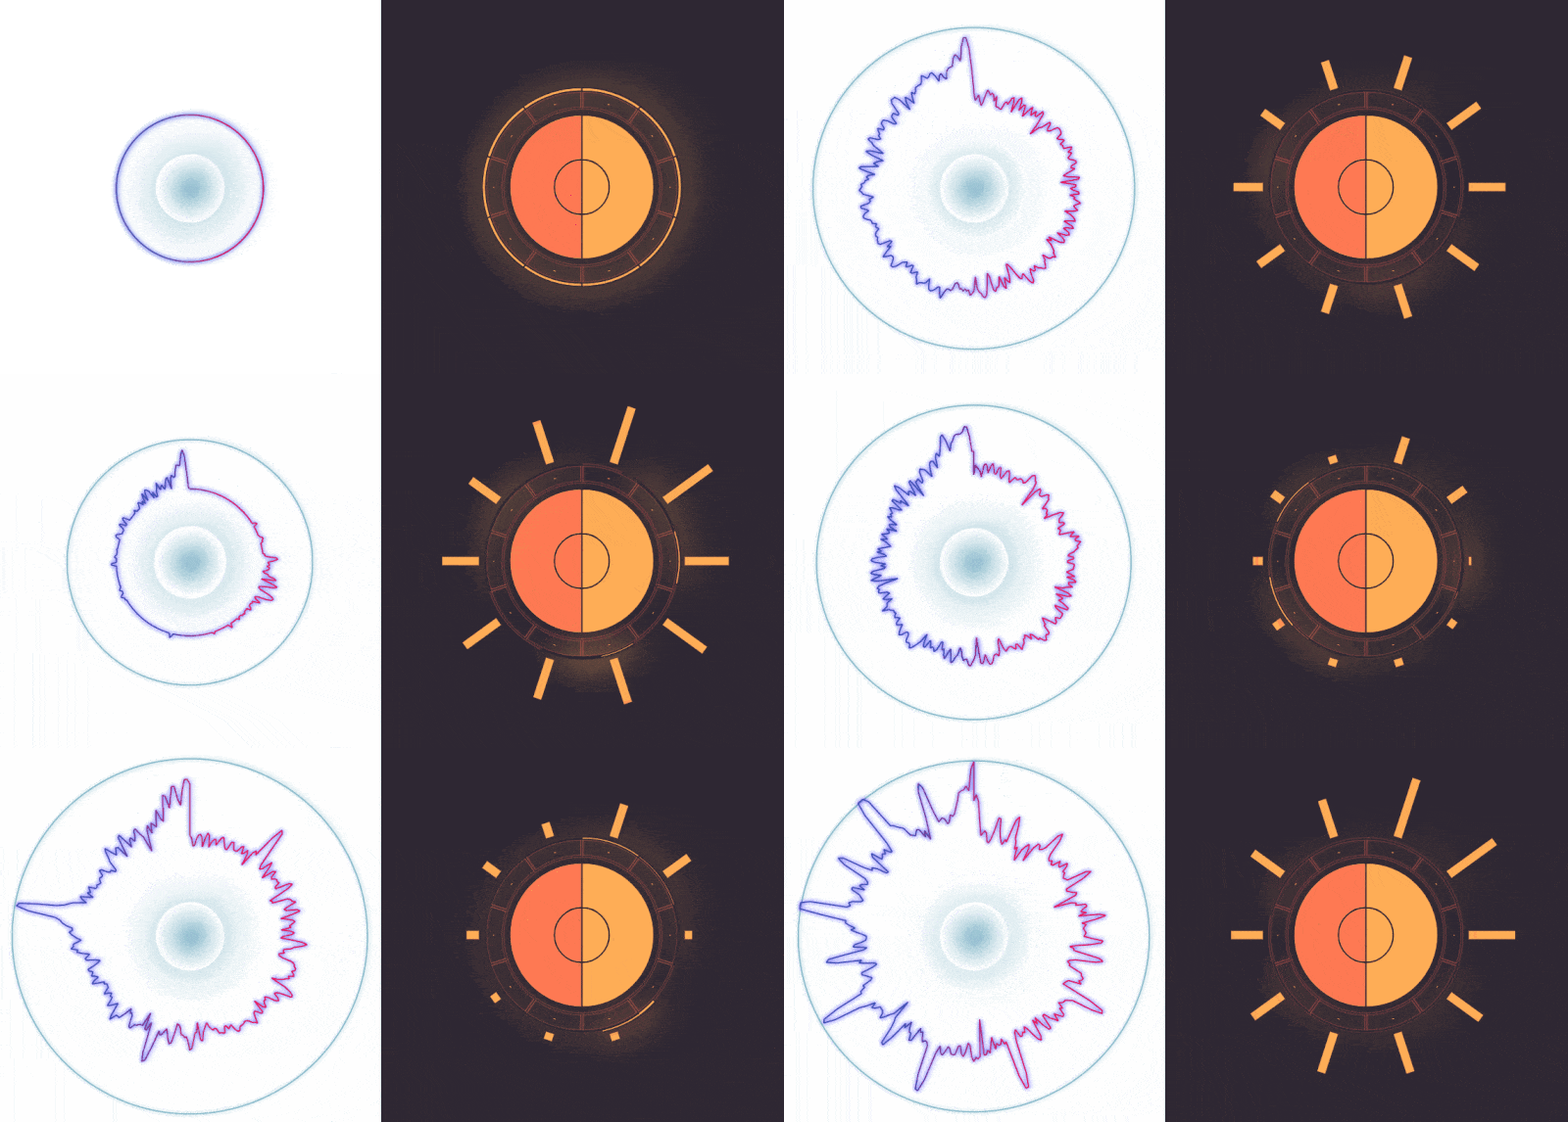
Live Demo: Circular Wave and Sunburst (Remember to adjust your audio first)
Visualizing the data in a dynamic and continuous way gives the real-time feeling to be in sync with the data status, especially true for audio. I was looking for a JS library for circular audio wave, which was in a form of a circular continuous line that changed when the audio frequency changed, but I couldn’t find one. There is a great list of audio visualization libraries on github called awesome-audio-visualization. I couldn’t find anything that fit my need there. Therefore, I decided to create a library for this purpose.


