I have been planning to write more articles, but in last few months I was quite busy on working for the project 1000class.com, which is a platform that helps students in California to find all the transferable courses with continuous up-to-date data from 100+ colleges. The project is quite stable now and I have more time to write more articles (there is a list of items I want to write….). Anyways, let’s get to the topic.
ECharts is “[a] powerful, interactive charting and visualization library for browser”, an open-source js library developed by the team of Baidu. The interface of ECharts is very simple that just takes an object for the options, and it can create thousands of visualization combinations. It can handle large data rendering in canvas or svg, and there are many chart types pre-defined already. It also has a very detailed documentation (although sometimes the Chinese version has better explanation).
Don’t get me wrong of pointing out the issue of it and disliking it. I love using ECharts a lot. Here I am focusing only on why the memory leak of ECharts occurs. For how to find it, I highly recommend reading this article written by Kayce Basques from Google https://developers.google.com/web/tools/chrome-devtools/memory-problems/.
I occasionally check if there is any memory leak in my code, and today I found out that ECharts had memory leak even after I disposed the chart. Here is a link to the demo: https://demo.kelvinau.net/echarts-memory-leak/.
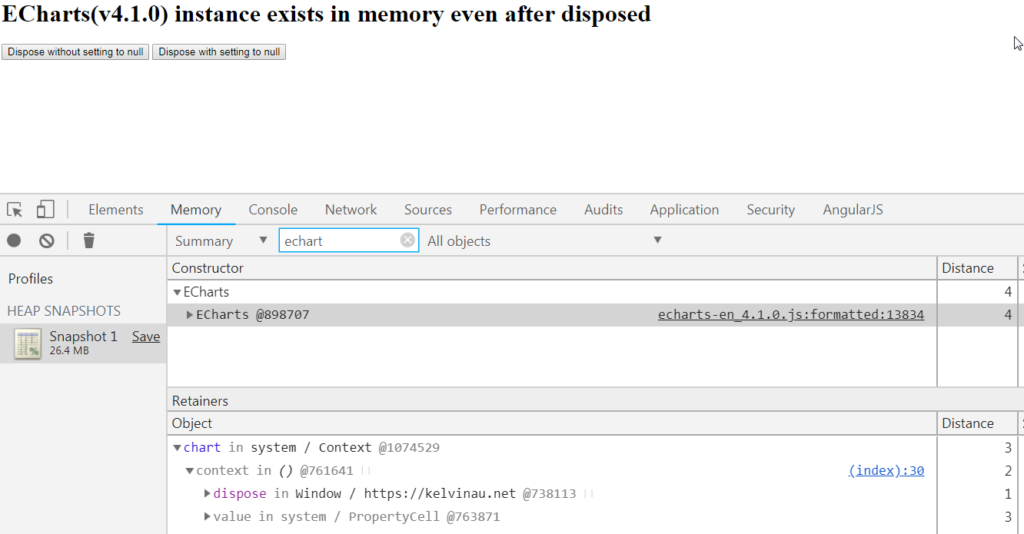
ECharts instance exists in memory
Clicking the first button “Dispose without setting to null” will call chart.dispose(), which is the official function to dispose the chart. Using Chrome Heap snapshot, I can see that ECharts instance still exists after disposed, so I take a look at the dispose function.
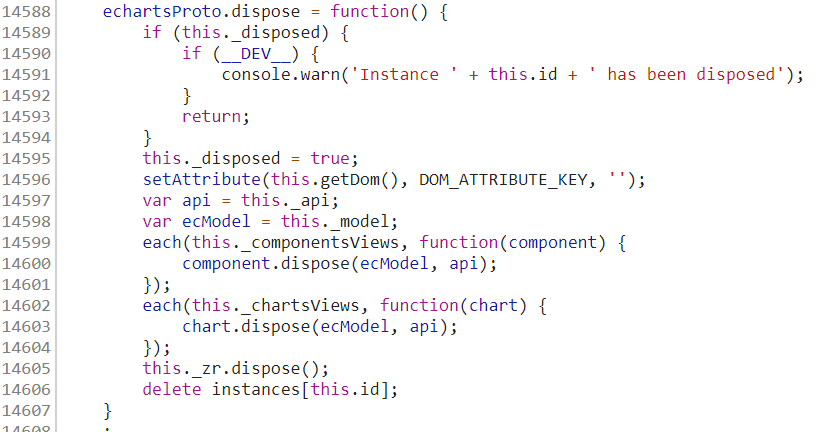
ECharts dispose function
The function is not very long, and it seems to be doing all sorts of cleaning. The only thing that looks strange to me is the first few lines. It checks if the instance is disposed, and gives a warning for dev version, and simply just returns.
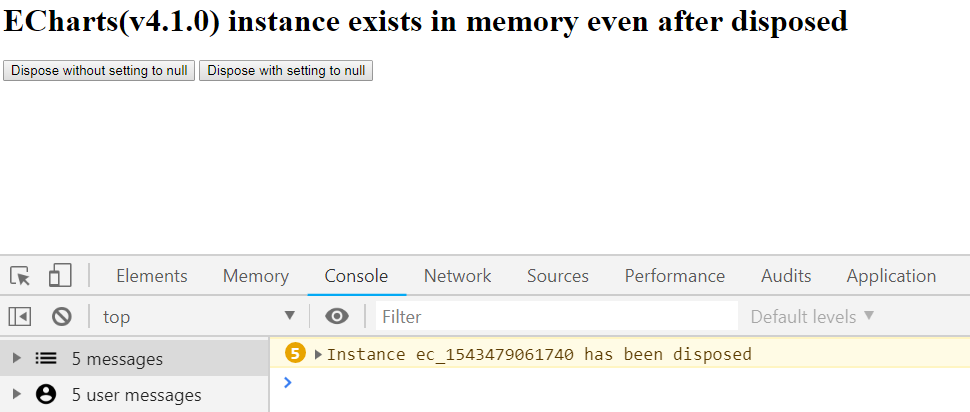
Clicking dispose button a few more times
The ECharts instance exists to check if it is disposed. I consider this as a feature. Setting a breakpoint there, you can take a look at this to see what is left in the instance.
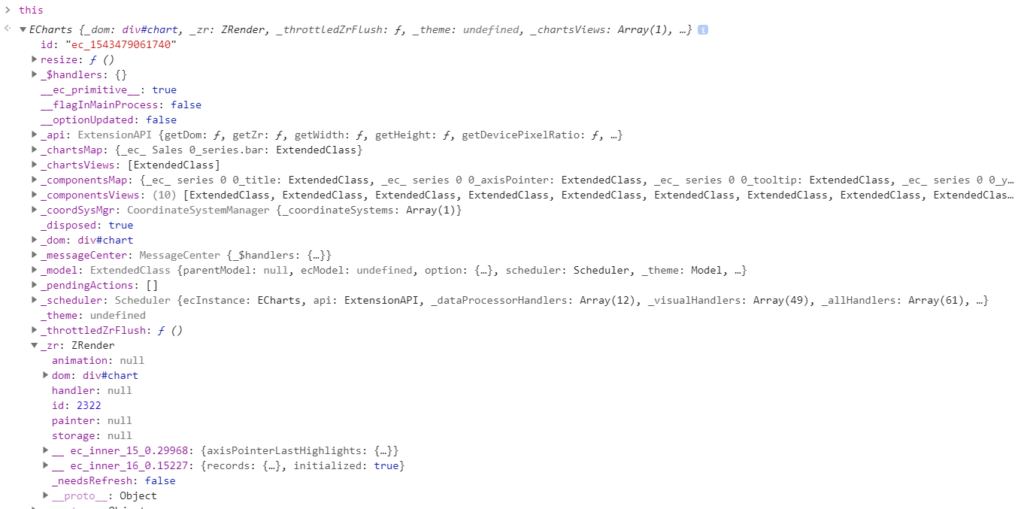
ECharts instance after disposed
I briefly took a look at it and already saw two DOM elements in the instance, and I believe there should be more.
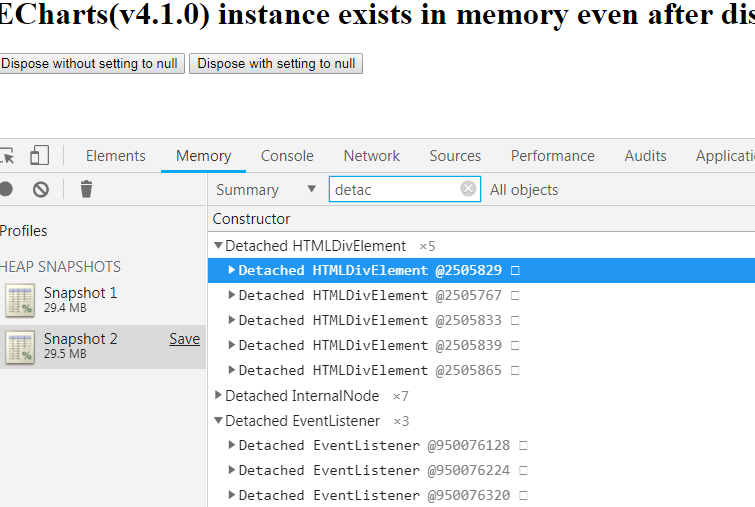
Detached DOM and EventListener
These detached can hold up memory of other parts of an application, as these cannot be automatically collected e.g. this.chart, $scope.chart.
In order to solve this, you should call chart = null after disposed, which is what the button “Dispose with setting to null” does. This will clear the whole ECharts instance and solve this memory issue.
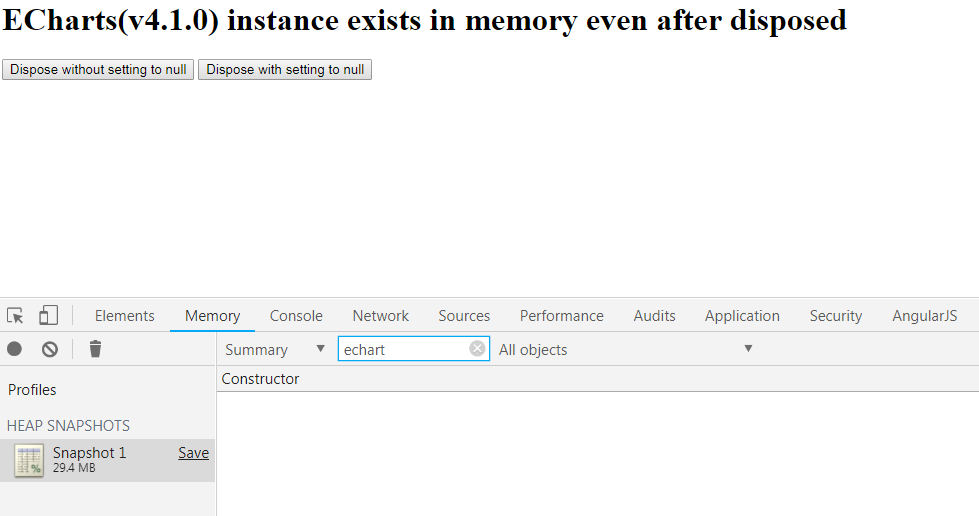
Setting chart to null after disposed

