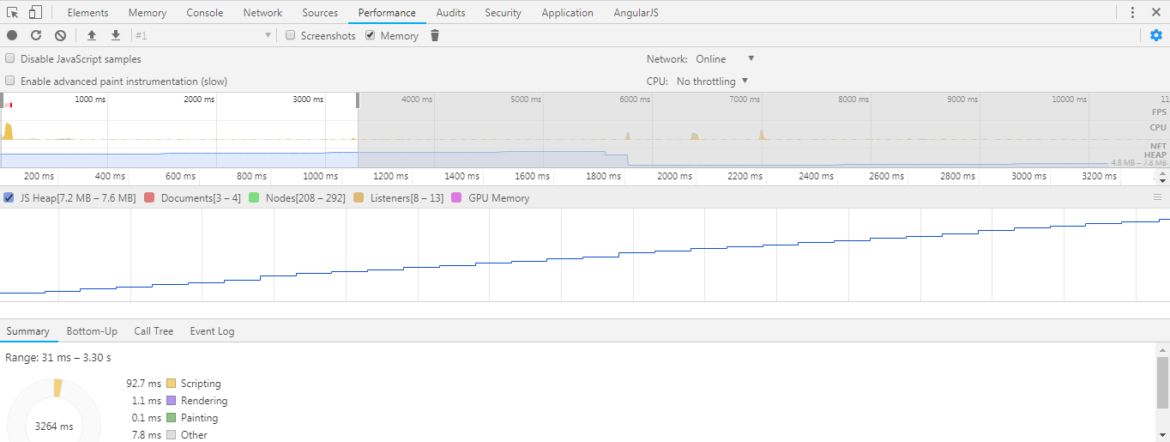
It was a windy day in Vancouver, and I was watching the trees slightly bending down through the windows. It was the memory leak of a complicated component that struggled me, and I had to walk away to get some fresh air and clear my mind for new thoughts. The problem would be easier if the component were not that complex and tightly coupled, and the issue would be identified easily. Refactoring the code was necessary, but I felt like I was just one step away from finding out the root cause of the leak.
After the first process of identifying the component that was causing the memory leak (performance recording, JS heap snapshot, Constructor/Retainer, etc), I opened that file and looked for anywhere it might smell. First thing I saw was the component controller name called ComponentCtrl. Yuck! I am in love with coding standard and naming conventions. I felt uncomfortable immediately with this name. Why? Imagine if we have multiple components that use the same controller name.
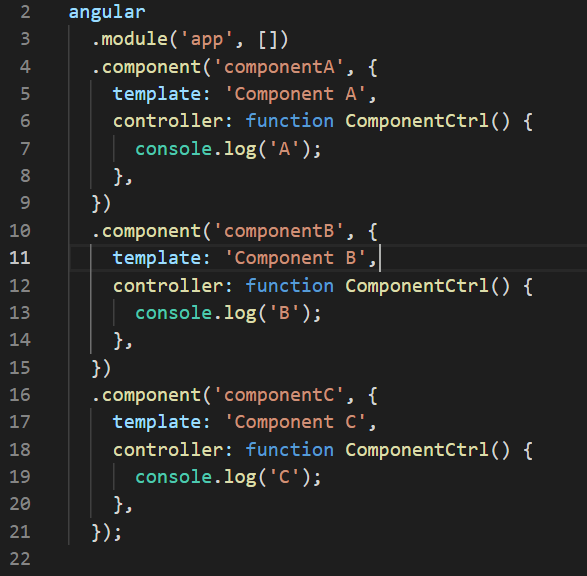
Same Controller Name ComponentCtrl
This won’t cause any issue with the functionalities, but it is a headache during memory leak analysis.
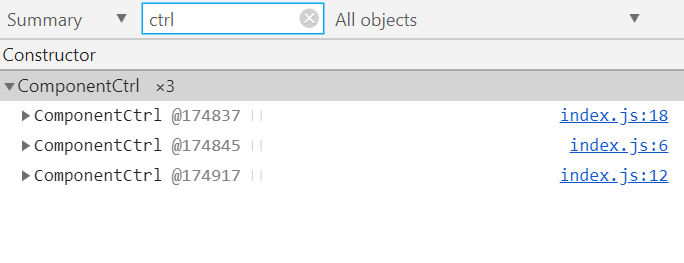
Heap Snapshot of ComponentCtrl
Which ComponentCtrl correspond to Component A/B/C? We can click the right link and navigate to that line of code to know that, but it becomes tedious if there are many controllers/constructors having the same name. Next time when we record another snapshot, we will need to look at it again. Simply give a more specific name can save a lot of clicks and uncertainties.

More Specific Naming Convention
Much more clear. Note that ES6 concise method and arrow function eventually create anonymous function in terms of constructor. As of ES6, if the name of the constructor is missing like an anonymous function, the name of the variable/property that holds the function will be used.
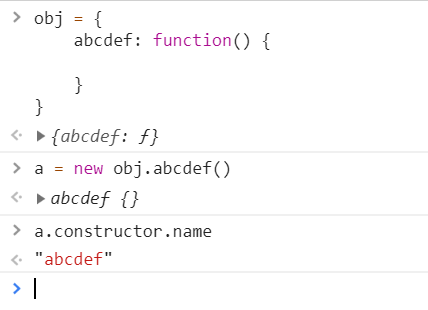
Name Taken from the Property
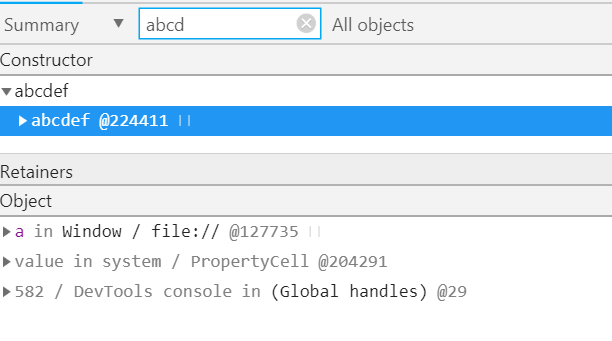
Name abcdef Shown in Heap Snapshot
However, it’s hard to locate where the final step when the constructor function is called and used on which variable/property for AngularJS, as there may be some other processing so we can’t search forcontrollerto find it. My point here is simply providing the function name to avoid this hassle.
Based on my experience, usually the most common cases for memory leak are:
-
- Lexical scope that holds a reference to an outer scope, and this scope is not destroyed even though the outer one is, which is very common for event binding or callback
- Detached DOM element
The first case of event binding and callback almost exists in every single large application.
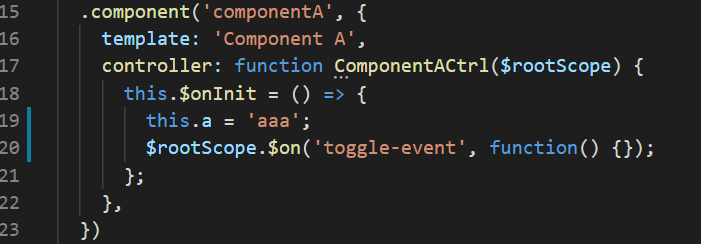
$rootScope Holding a Reference of the scope of ComponentACtrl
This is a common AngularJS memory leak example. However, the same concept applies in general. When the scope of componentA is destroyed, AngularJS clears everything in the scope and let the engine to collect the garbage and reclaim memory. There is a special handling for IE 9 too (unsurprisingly).

AngularJS Cleaning Up Scope #1
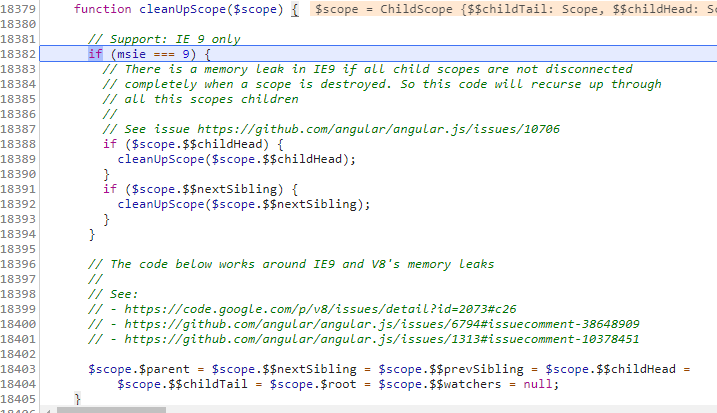
AngularJS Cleaning Up Scope #2
However, $rootScope needs the scope of componentACtrl as its event toggle-event has a call back that has the reference to this scope. It doesn’t matter if it uses any variable inside the callback or not. It matters only if it has a closure of the outer scope. There are a few scenarios in this case and they can have different outcomes:
1. Holding a reference of the controller scope

Holding a reference of the controller scope
As the outer function has this.a = 'aaa', it needs and holds this, which is the scope of the controller ComponentACtrl because of the arrow function. After destroying the component, the memory of the whole controller scope cannot be released.
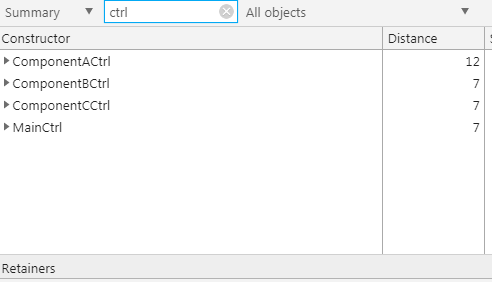
Scope of ComponentACtrl cannot be released
The distance is also farther away from window object compared to ComponentBCtrl and ComponentCCtrl. If this is not used, we won’t see ComponentACtrl in here. Then it comes to the second case.
2. Holding a reference of the outer function

Holding a reference of the outer function
If we have no other statements/assignments in the outer function besides the event registration, and we don’t use arrow function, ComponentACtrl will not show up in the snapshot. Does that mean memory leak problem is solved, and hence closure doesn’t occur? Obviously not. It’s just that there’s no constructor name can be found for this function. Record a snapshot before destroying and another one after creating componentA, and compare the result .

Delta Equal to +1
As I expect that the changes of some of the items stayed in memory should be increased by exactly 1, so I sort it by Delta and look for it.

Closure and Context Increased by one
Exactly as it says, closure is increased by one. If we also check (closure) for case 1, it actually increases by two, because besides the callback function itself, it also has the reference to all other functions on the controller scope, which includes $onInit.
3. No callback
When there’s no callback for the event, no closure is needed and thus no memory leak will happen. However, depending on the exact implementation of the event binding, the memory may still increase. Because every time it renders the element, a binding still happens. In AngularJS, it will push a callback listener of undefined into $$listeners, but it will later on remove it.
The idea is similar to detached DOM. A DOM is considered as detached when it doesn’t exist in the DOM tree but it has a reference in memory. The meaning of detached in here is not exactly the same as Virtual DOM, which is used to render selectively based on state changes. Detached DOM refers to the native DOM element object being detached. Normally if we keep a reference in a lexical scope and do not store it outside of the scope, it will be garbage collected automatically.
Up until this point, I still haven’t shared my gotcha of that memory analysis. I checked for event binding and any DOM element manipulation and references (there were a lot…). They all seemed good. What went wrong? I stared at this for a while and took a break. Solutions usually come up after my mind flushed out for 15 minutes.
First idea I came up with was using a dirty way to confirm if it actually leaked from this component — commented out all the code inside the controller. Not surprisingly, the memory leak issue disappeared, so that confirmed my very first process of identifying this component correctly. I uncommented it, took a snapshot, and looked at the snapshot again. This time I saw something that I didn’t see before.
The distance of the item was ‘ — ‘, and it’s said “DevTools console” right below.
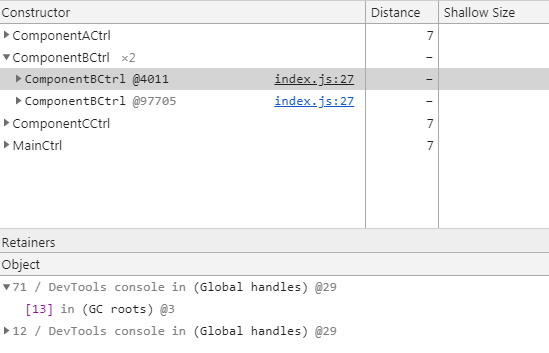
Leak in DevTools console
My actual case had way more items in the snapshot, but still, how could I miss that? It was all just because of a console.log(this)! The console held the reference of the scope for us to click and inspect, and so it had the reference of it (note that console.log increases JS heap only if we open up the debugger).
Why did we console log the whole scope? There are a lot of tools and plugins to visualize it already. It may be convenient during early development, which I won’t do it anyways, but this should be removed when the code is quite stable. I somehow felt like in the old days of missing a semi-colon in those compile languages, except those told me exactly which line’s missing it. A side story: there was once we were looking at why a new file with one statement added was not working in our application, and it was all because of missing a semi-colon. We used Gulp to concatenate all the codes and it thought that the statement was a function call, which used the next file for the parameters, i.e.(function(){...}(module.exports))(function(){...})(module.export); The library of lazy loading caught the error somewhere and lost the initial trace. That took us an hour to find it out.
Memory leak analysis is fun as it always tests our understanding of a lot of JS concepts. It also helps us to write better code and reminds us good practices of development. For the simple demo I referenced in this post, I pushed it to here: https://demo.kelvinau.net/console-log-this
Stay tuned for my next memory analysis case!

